Map Smart List to Dimension
As you all notice PBCS does not yet offer the possibility to create attribute dimensions. One of the solutions to get around this is to choose to map a smart list to a dimension in the map reporting module. Follow the steps below to configure your mapping.
Let’s assume that you already have 2 plan types, one BSO and one ASO. In the example below, my plan type names are Finance for the BSO and rFinance for the ASO. In the project where I implemented this solution, I only needed 2 different attributes (Department and Service type) and I didn’t need any customized dimensions.
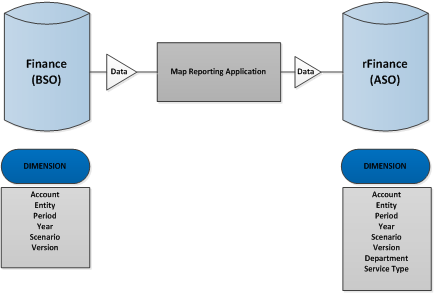
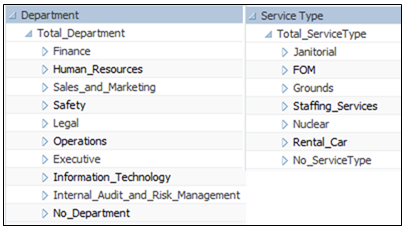
- First you need to create the ASO dimensions representing the desired attributes. In my example I have two different attributes: Department and Service Type. On each of these dimensions create the members representing the value of your attribute. Please note that the members’ name must match the value of the smart list consequently, they need to follow the naming convention of the smart list (no spaces or special characters). You will also notice that for each of the dimensions I have created a default member (No_***), I will explain why I did this a bit later on in the post.
- On the second step we will create the smart list. To do that click on Administration -> Manage -> Smart lists. Then create the new smart lists by clicking on add.

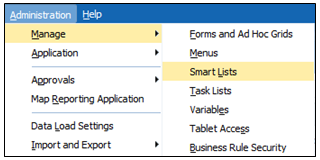 For now just create the smart lists, we will add value in other steps.
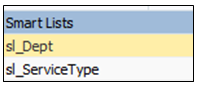
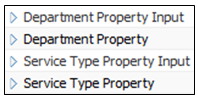
- Now, we will create the BSO members linked to the smart list. Go to your BSO outline and on the account dimension create 4 members’ names, Department Property, Department Property Input, Service Type Property and Service Type Property Input. Link these members to the correct smart list.
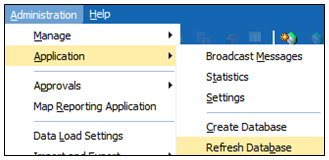
- Once this step in finished go to refresh the app by clicking on Administration -> Application -> Refresh Database.
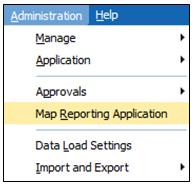
- Now that all members and smart lists are created, let’s create the map reporting application. To do that click on Administration -> Map Reporting Application then click on add.
 On the first tab choose your source (Finance) and reporting (rFinance) application, and don’t forget to add a name to the map reporting.
On the second tab for the department and service type row choose the Smart List to Dimension mapping type, and then choose the appropriate smart list. On the member section choose Department Property and Service Type Property members and click on save.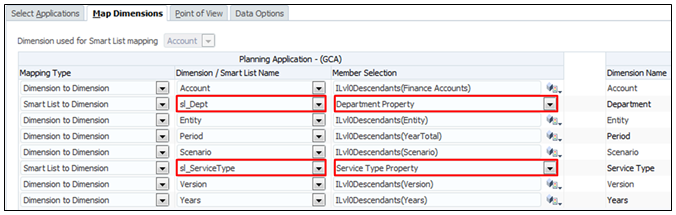
Now you should see on the screen the application mapping that you have just created. Select it and refresh it by clicking on refresh

- Now we will go back to the smart lists that we created in the second step. Since we have linked these smart lists to a dimension, we can now update them automatically. This can help you save a lot of time if you have smart lists with 50 members or more.
To do this, go on the smart list screen (see step 2). Once you are there, select the smart list and click on synchronize.

Once this is done, the message below should appear.
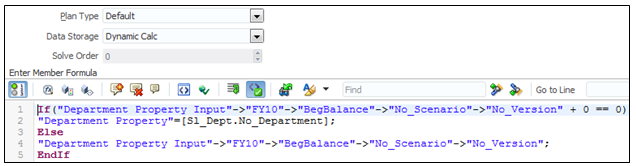
- In order to make the smart list to dimension work, we need to assign an attribute value to every intersection for which we have data. For easy maintenance and to avoid business rules that are running for too long, we will do this by attaching a formula to a member (Department Property and Service Type Property). Go to your outline and edit these members by making them dynamic and by adding the formula that you see in the screen shot below (this formula might need to be updated depending on the name and number of dimensions that you have in your application). You will see in the formula that I’m defaulting the value of the attribute to No_Department, this is because you can’t leave any intersection #missing it will lead the map reporting to an error.
- The final step is to create the form where the user can set up the attribute of their choice for every entity.
Go to the form panel to create your form, in the POV section put the member that you put in the above formula. In the row put the level 0 entity and in the column put the member Department Property Input and Service Type Property Input.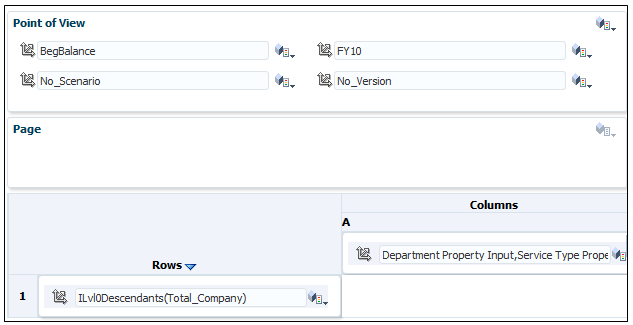
You can now push your data using the previous map reporting application.
Pro: This solution is very easy to maintain for the admin, and if needed you can also let a user play with the attributes.
Con: If you have too many attributes, this can make the size of the application get too big and consequently slower.
This is definitely a nice blog post but I couldn’t see the screenshots. If you could upload these, that will be awesome
Thank you for the feedback. We updated the links and images are now available.