Use PowerShell to split large files by month/year for data loads into FDMEE on PBCS

If you are using PBCS, you may run into some challenges with large files being passed through FDMEE.  Whether performance is an issue or you just want to parse a file my month/year, this script might save you some time.

The Challenge

I recently had the need to break apart a file.  The source provided one large text file that included 2 years of data that was needed to populate the history of an employee metrics application.  The current process loaded files by month and we wanted to be able to piggy back off the existing scripts to load and process data in FDMEE and the monthly Planning data pushes to the ASO reporting cube.  So, the need break the data file into seperate files by month and year was required.  The file was delimited and formatted like the following.

Entity,Year,Scenario,Period,Account,Date,Employee,Pay Code,JobNumber,Data
BU1005,FY15,Actual,Feb,Pay Amount,02/02/2015,V1398950,P105,,108.10
BU1005,FY15,Actual,Feb,Pay Amount,02/03/2015,V1398950,P105,,108.92

The goal was to have a file for every unique month and year combination that included only the lines of the relevant time periods.  The header of the file also had to exist in each of the smaller files.  Since we were working on a Windows machine, we used PowerShell to script the solution.

Powershell Script Directions

The script is pretty simple to use and understand.  Update the script as follows.

  1. Create a new text file with a ps1 extension and paste the following into that file.
  2. Update the srcFile variable to point to the file to be parsed.
  3. Update the startYear to the first year in the file to be extracted.
  4. Update the currentYear variable to the last year in the file to be extracted.
  5. Update the ProcessName to a meaningful word or phrase that will be used to create the file name.
  6. Save the file and execute it like any other PowerShell script.

This will produce 12 files for each year with the header line and the data related to the month and year that represents the year and month in the file name.

Disclaimer

I welcome feedback on improving performance and will give credit to anybody that can improve on this.  I am NOT an expert in PowerShell and I am sure there are faster ways to accomplish this.  This created 12 files (1 year / 12 months) from a file that includes 7.8 million records and completed in 24 minutes.  So, this is pretty reasonable for one-off requests, but might need attention if it was a repeatable need.

This was developed using PowerShell 5 and some functions do not work in earlier adoptions of the software.

Powershell Script

#######################################################################
# Set the file to parse
# 
# Set the start year and end year
# 
# Change the counter if you want the files produced to start at
# something other than 1
#######################################################################
# Write a status to the screen to monitor progress
write-host "Processing started at $($(Get-Date).ToShortTimeString())"

# Update to point to the source file
$srcFile = "C:\Oracle\GCA\Data\Files\2015 Time Data\Time_DataPayAmount2015.csv" 

# Set to the first year you want to process
$startYear = 2015 
# Set to the last year you want to process
$currentYear = 2016 

# Used in the naming, is the starting number in name and increments by 1
$counter = 1 

# Get the first line (the header line) of the file 
$Header =  Get-Content $srcFile -First 1 

# Set the process name used in the file name 
$ProcessName = "Test Process" 

# Loop through each year in the range 
ForEach ($Years in $startYear..$currentYear )
 {
   # Loop through each month of the year
   ForEach ($months in 1..12 )
   {
     # Get the 3 month abbreviation of the month being processed
     $ShortMonth = (Get-Culture).DateTimeFormat.GetAbbreviatedMonthName($months)

     # Format year to FYxx (This is typically required on a Planning application)
     $FormattedYear = "FY" + 
     $Years.ToString().substring($Years.ToString().length - 2, 2)

     # Set the file name to a number starting with 1, the Month, and the year
     # Example: 01_ProcessName_Jan_2015.txt
     $FileOut = "{0:00}" -f $counter++ + "_" + $ProcessName + "_" + 
     $ShortMonth + "_" + $Years + '.txt'

     # Write out the header to the newly created file file
     $Header | out-file -filepath $FileOut -Encoding utf8  

     # Write out all the lines that match the month and year. The pattern 
     # includes a ".*" which is the equivalent of an AND conjunction, so 
     # the line has to include the processing year AND processing month 
     # for it to be included.
     select-string $srcFile -pattern "${FormattedYear}.*($($ShortMonth))" | 
     foreach {$_.Line} | out-file -filepath $FileOut -Encoding utf8 -Append

     # Write a status to the screen - this is not required but provides a level
     # of the current progress by communicating the Month/Year completed and the
     # time it completed  
     write-host $fileout "Completed at $($(Get-Date).ToShortTimeString())"
   }
 }

Conclusion

Hopefully this will benefit the community.  As I create more scripts like this, I plan to share them.


Financial Reporting with Rolling Years and Periods (Step 4 of 4)

Step 4: Adding ‘Advanced Suppression’ to each of the Year & Period columns.

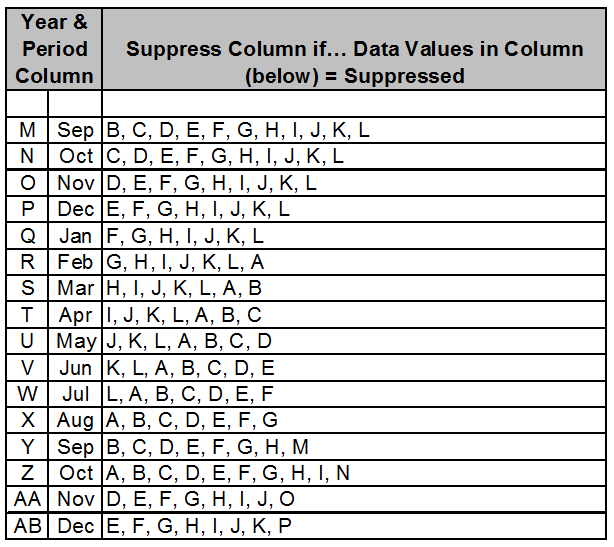
Step 4 in the development of this report contains a majority of the logic to be setup which will allow a range of periods to be displayed to users. The idea behind the logic in this section is to move the range of periods displayed to users based on the Period selected in the User POV. The “Range Matrix” below will shed some light on what should be displayed based on what is selected.

Just as Conditional Suppression was setup for the trigger columns, Conditional Suppression will need setup for these Year/Period columns. The difference between the “Trigger” section and the “Year/Period” section resides on how columns are chosen to be suppressed. As the name suggests, the “Trigger” section added in steps 1 & 2 will drive the conditional logic, and thus the range of Periods displayed to users. The examples below display a high-level subset of the column logic.

Example 1:

  • User selects “Jan” as the Period.
    • Which Periods will be displayed?
    • Sep (Prior Year)
    • Oct (Prior Year)
    • Nov (Prior Year)
    • Dec (Prior Year)
    • Jan (Current Year)
    • Which Periods will be hidden (suppressed)?
    • Feb-Dec (Current Year)


Example 2:

  • User selects “Sep” as the Period.
    • Which Periods will be displayed?
    • May (Current Year)
    • Jun (Current Year)
    • Jul (Current Year)
    • Aug (Current Year)
    • Sep (Current Year)
    • Which Periods will be hidden (suppressed)?
    • Sep-Dec (Prior Year)
    • Jan-Apr (Current Year)
    • Oct-Dec (Current Year)


When adding columns to a report, each column will be tagged with an alphanumeric value that identifies the column number. Staying true to the rolling 5-month solution, columns “A” through “L” of your report identify the “Trigger” section (Jan equals “A”, Feb equals “B”… Dec equals “L”). The “Year & Period” section is identified by columns “M” through “AB” of your report (Sep of Prior Year equals “M”, Oct of prior year equals “N”… Dec of current year equals “AB”). When setting up the “Year & Period” Conditional Suppression, it is imperative that you know and understand which Periods correlate to which column numbers.

“Trigger” Section:

“Year & Period” Section:

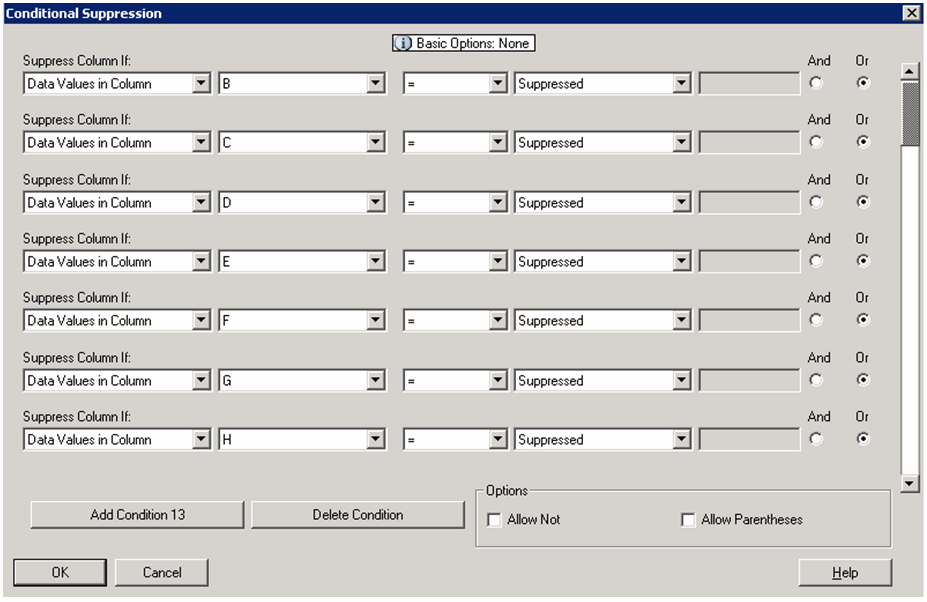
The Conditional Suppression will need added to all “Year & Period” section columns (columns “M” through “AB” in the above images). Column “M” (which correlates to “Sep” of prior year) will need displayed to the user ONLY when the user selects “Jan” for the current POV of the Period dimension. By selecting “Jan”, the user is requesting to see data for Sep-Dec of the Prior Year, and Jan of the current year (as shown above in the “Range Matrix”). A subset of the Hyperion Reporting logic is shown in the image below. Similar logic is required for the remaining columns of the “Year & Period” section (columns “N” through “AB”) with the only difference being the suppressed “Trigger” columns selected.

Hyperion Reporting – Conditional Suppression Logic:


Year & Period Suppression Logic:


As stated before, the “Trigger” section of the report drives what is ultimately displayed to the user, and this is based on what the user selects in the User POV for Period. If a report requirement exists for something other than a 5-month rolling view, the number of “Year & Period” section columns would need adjusted, as would the Conditional Suppression logic, but the “Trigger” section will not need adjusted. The overall idea of how to implement this solution remains intact. Please feel free to contact me directly with any questions on implementing a solution such as this, I’m happy to assist when possible.


Financial Reporting with Rolling Years and Periods (Step 2 of 4)

Step 2: Adding ‘Advanced Suppression’ to each of the 12 Trigger columns.

The Conditional Suppression set on each of these columns (see Step 1) will suppress the column that correlates to the Period selected. If the end-user selects Jan, then the column representing Jan will be suppressed. This is used later in step 4 of the report development.

Keys:

  • The Advanced (Conditional) Suppression for each column relates to the 12 Periods added in Step 1.
  • The logic for Jan is as follows:
    • Suppress Column If:
      • “Member Name” “Period” “equals” “Jan”.
      • “Jan” is the actual member name.
  • The same logic in place for Jan will be required for the Feb-Dec columns, Thus…
    • Suppress Column If:
      • “Member Name” “Period” “equals” “Feb”.
      • “Feb” is the actual member name.
      • Etc…
  • Once steps 1 & 2 are complete, development of the trigger section has been finished.


Financial Reporting with Rolling Years and Periods (Step 1 of 4)

If you have worked with Hyperion Financial Reporting, odds are good that you’ve come across report requirements for Rolling Years and Periods, that is to say a report that spans periods from multiple years. This is an easy build if your data source includes a single “rolling” dimension for ‘Year’ and ‘Period’ – you utilize the “RelativeMember” function to move up or down the hierarchy. The difficulty arises when programming this same logic into a report with separate ‘Year’ and ‘Period’ dimensions. A solution utilizing “Trigger” columns is shown below.

The use of what I call trigger columns allows for Hyperion Financial Reporting to display rolling Years and Periods, whether your requirement is for a 2 or 12 month rolling report. The Trigger section of the report requires both the ‘Year’ and ‘Period’ dimension to be columns on the report, while any dimension; such as Account or Product, can be included on the rows. The steps below detail a rolling 5-month solution.

Step 1:  Add data columns for all 12 periods (Jan-Dec).

These columns will function as the Trigger section, essentially telling the other columns what the end-user selected for Period. This is important because later sections of the report require knowledge of the selected Period to ultimately decide what is displayed.

Keys:

  • These 12 columns MUST be Data columns.
  • These 12 columns MUST be hidden.
  • The Period member selection MUST be set to “Current Point of View for Period”.
  • The Year member can be any member – not relevant to the trigger.

  • Optional: Overwrite the Period POV cell with the 12 periods (Jan-Dec) as shown below.