Announcing the Essbase Ribbon, Part 2 – Power Adhoc Ribbon

Many of you used the Essbase ribbon I built 10+ years ago. I have been asked by many to build a similar ribbon for Smart View. Today I am introducing the Power Adhoc Ribbon. It has all the bells and whistles of the old ribbon completely re-engineered for Smart View. There is a nominal fee, but you can try it for free. Some of the awesome features are summarized below.

The Power Adhoc Ribbon has it’s own website where you can get updates, download the most recent version, and read more about what the options and future enhancements. Head over to the Power Adhoc website for all the details.

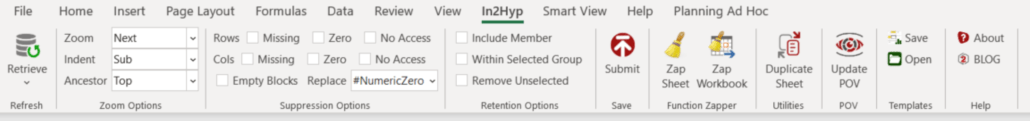
  • Refreshing worksheets is the cornerstone of any adhoc reporting. We put refresh on steroids. You can refresh the worksheet or all the worksheets in the workbook, but we added even more. The ribbon has two other options that let you refresh with suppression on or off, without changing your Smart View settings.
  • We know you change your aliases all the time. Now it sits on the ribbon to toggle it on the fly. Change between no aliases and the default aliases whenever you want, quickly and efficiently.
  • The ribbon also includes quick options to change your aliases between default and none. It doesn’t stop there. You can also toggle your formatting between Excel and Cell Styles.
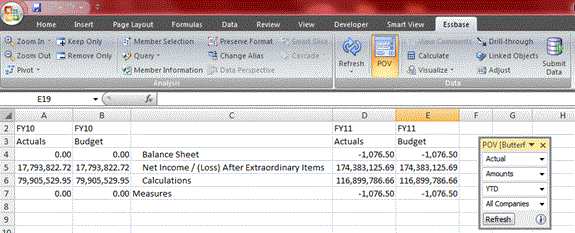
  • Now, all your most commonly edited worksheet settings are on the ribbon, including zoom, suppression, and retention. When you change worksheets, the ribbon automatically updates to reflect the current worksheet settings.
  • What do you do when you want to distribute those workbooks with Smart View functions? Zap will remove all the functions in your worksheet or workbook with the values they return and leave any Excel formulas.
  • How many times have you wanted to duplicate a worksheet and been frustrated because it doesn’t copy your settings and connection? That is now a thing of the past. The worksheet duplicator will copy any worksheet and include the connection and worksheet settings.
  • The Power Adhoc ribbon adds a complete template management vehicle. Commonly used worksheets can be saved in groupings and reused at a later time by opening them right from the ribbon. Group them by application, purpose, or however you want. Templates can be starter adhocs or standard reports. You manage your templates and how they are organized. Your templates can be renamed, reorganized, or removed at any time.
  • Power Options allows you to show/hide the options you want. You no longer need to see the options that aren’t relevant to you.
  • Because you maintain your subscription, we can easily let you know when updates are released.  As soon as any improvements are available, you will be the first to know.
  • Not everything on the ribbon will be new to you. To reduce the need to toggle between ribbons, the most commonly used options from Smart View are included.
  • To reduce the learning curve, every option has a power tooltip that explains its purpose.
  • By having a subscription, you get all the updates and you decide what enhancements are prioritized. If there is an enhancement you need, ask for it.
  • Many operations, like refreshing and submitting, can sometimes take longer than you expect. Just to make sure you can monitor those requests, we notify you how long it took by updating Excel Status Bar.


Excel Ribbon Part Duex – I got a second wind!

For years, people have asked me to build a new ribbon to supplement Smart View that replicates the functionality I have in my Essbase Ribbon.  Multiple people have hacked into it and made it their own.  One company is selling it.  For that reason, I had zero interest in doing it again.  Time has passed, and here I am, building a ribbon.  It will again have common functions in one place, as well as some additional ones, like


  • Copy a worksheet that includes all the Smart View settings and connection information
  • HS Zapper function that will replace any cell with one of the HS functions with the value it returns for all you folks that use HSGet and its sister and brother functions.
  • Template manager that will allow you to create/manage/update templates, whether they be complicated workbooks, or just starting points for a new adhoc
  • A connection manager that will automatically log you in to an environment
    • Maybe a Shared Connection switcher to easily toggle environments
  • A bulk copy/paste option that to put in the POVs
  • Functions like retrieve with suppression, retrieve without suppression, so you don’t have to constantly change the options

This will not be written as a VBA addin.  It will be a full-blown DLL written in C# to optimize security and performance.  It will come with an installation process that will allow easy installation updates.

If you would like to be a beta tester, I am looking for 20-30 people.  If you are interested, send me a message through the contact option at In2hyperion.com.  I will include people up to the a limit to make it somewhat reasonable to manage feedback.  If you want to ensure inclusion, let me know ASAP.  It will be first come, first serve. It will be ready in weeks.

This is what you can expect as a starting point.


Drill Through to Data Management and Stay In Excel

There is a new, and often requested, option added to Smart View.  If you use drill through to Data Management (PBCS) or FDMEE (On Prem), download the most recent release of Smart View.  We, as users, now have the option to change where the result of our drill through queries is returned.  Users can either be asked where the result should be displayed, have it displayed in your browser, or (drum roll) have another tab created that holds the results in Excel.

Change Your Option

This isn’t a complicated or drawn out explanation, but it is sexy!  To change where the results are displayed, go to your Smart View ribbon and click Options to open the dialogue.  Select the Advanced tab on the left and scroll down just a tad.  You will see an option for Drill-Through Launch.  The 3 options previously mentioned are available.  This removes one of the biggest user frustrations regarding drill-through reporting and will surely make a lot of people happy.

The Proof Is In The Pudding

It works just as you would expect, but here is the proof.  When you open a retrieve and connect to the application, right click on a cell.  Click on Drill-through as you always have.

If the data has more detailed data available, a new worksheet will be created in your workbook with the results if you have chosen the In New Sheet option.

Not Much Else To Cover

That is it.  There isn’t much else to say, but this is a great and frequently requested feature.  We can finally provide a good answer.

Absolutely you can drill through to the detail and have it returned in Excel.

As always, post a comment if you have something to share with the community or have additional questions about this topic.


Managing Smart View Shared Connections

If you use Smart View, you are familiar with the Smart View Shared Connection URL, which is unique to the environment that Smart View connects.  That property is saved in a file on your computer and has the default URL, as well as all the saves URLs in the drop-down list.

There are times users want this drop down cleaned up.  If the URL changes due to environment changes, or they enter the wrong URL and it is saved, the need to clean up what is in this setting can reduce confusion and user frustration.  Often, IT departments want to deploy these settings and need to understand how to make every user’s Smart View configuration the same.  Understanding where these settings are stored and how the file that stores them is configured will assistance with either of these requests.

The user’s computer will hold, or require a file if a new deployment of settings is the path IT takes, in the following folder.

<drive>:\Users\<username>\AppData\Roaming\Oracle\SmartView

The drive is almost always C, and the username is unique to every organization in the naming convention used.  If the user already has setup Smart View, a file named properties.xml exists.  This file can be edited in any text editor.  If you are familiar with XML files, you will see a typical XML structure.

The entire file is enclosed in a cfg tag, so it is opened with <cfg> and closed with </cfg>.  The current provider URL is within a provider tag.  All saves provider URLs are inside a previousURLList tag and separated by a pipe (|) delimiter.  So, the file is laid out like this.

<?xml version=”1.0″?>
<cfg>
<provider></provider>
<previousURLList>provider 1|provider 2|provider 3|…</previousURLList>
</cfg>

As a consultant, I have many providers saved, so the configuration.xml file on my system looks like a little busy.  The file will likely be smashed together and not easily readable.  Opened in a text editor:

<?xml version=”1.0″?><cfg><provider><overrideWorkspaceUrl>https://planning-test-a499161.pbcs.us6.oraclecloud.com/workspace/SmartViewProviders</overrideWorkspaceUrl><previousURLList>http://mp1epm01:19000/SmartViewProviders|http://mp1epm01:19000/workspace/|https://planning-a499161.pbcs.us6.oraclecloud.com/workspace/SmartViewProviders|https://planning-test-a499161.pbcs.us6.oraclecloud.com/workspace/SmartViewProviders|https://planning-test-a499161.pbcs.us2.oraclecloud.com/workspace/SmartViewProviders|https://planning-test-shiloh.pbcs.us2.oraclecloud.com/workspace/SmartViewProvidersx|http://mp1epm01.huronconsultinggroup.com:19000/workspace/SmartViewProviders|https://mp1epm01:19000/SmartViewProviders|https://mp1epm01.huronconsultinggroup.com:19000/aps/SmartView|https://mp1epm01.huronconsultinggroup.com:13080/SmartViewProviders</previousURLList><overrideUrl/></provider></cfg>

If this file is opened in an XML editor, or viewed in Internet Explorer, it will be more readable.

If old providers need to be removed, they can be deleted from this file and the user will see the change the next time Excel is started. If there is a need to distribute a pre-configured setup, build this file manually, or use an existing user’s file, and deploy it to all new users.


Using a Shared Connection with HSGetValue/HSSetValue with Planning or PBCS

If you are a fan of the HSGetValue and HSSetValue, you probably are using a private connection. As you know, anybody that uses the template has to either change the connection string to their own predefined private connection, or set up a private connection with the same name. When dealing with inexperience users, both methods can be problematic.

You may be surprised to know that the Get and Set Value functions can use a shared connection.Rather than using the private connection name, the following can be specified to use a shared connection in place of the private connection name.

Private connection syntax:
HsGetValue(“PrivateConnectionName”,”POV”)
HsSetValue (dollar amount,”PrivateConnectionName”,”POV”)

Shared connection syntax:

HsGetValue(“WSFN|ProviderType|Server|Application|Database”,”POV”)
HsSetValue (dollar amount,”WSFN|ProviderType|Server|Application|Database”,”POV”)

Parameter Summary

  • “WSFN” is a static string and never changes
  • The provider type for planning is “HP” regardless of whether the server is a cloud server or on premise server
  • The server specifies the location of the server housing the application. For PBCS, use the URL provided by Oracle (planning-test-domain.pbcs.us2.oraclecloud.com)
  • The application is the application name
  • The database is the plan type, or database name

Put that all together and the string looks like this.
WSFN|HP|planning-test-A12345.pbcs.us2.oraclecloud.com|Finance|Revenue

Conclusion

Although there are a few drawbacks to using a shared connection (users could use the wrong connection and not get the expected result), my experience has been that the pros (no setup of private connections, can be used in multiple environments without changing anything, etc.) far outweigh the cons.


Force Excel to Calculate Dependencies In Order

Overview

If you have ever used custom functions in Excel, depending on the complexity of them, you have probably run into an issue where the accuracy of the results was sporadic. There is a quick solution.Use CTRL ALT SHIFT F9.

The lengthier explanation from Microsoft explains that the calculation of worksheets in Excel can be viewed as a three-stage process:

  • Construction of a dependency tree
  • Construction of a calculation chain
  • Recalculation of cell

With the introduction of complex VBA functions, the default calculation can produce inaccurate results because it doesn’t evaluate the dependency tree and calculation chain correctly.

So, if you have this issue, the most complete and thorough (and time consuming) calculation can be initiated by clicking CTRL ALT SHIFT F9. This forces the dependency tree to be rebuilt and recalculates the entire workbook. There are several levels in forcing Excel to calculate.

F9

Recalculates all cells that Excel has marked as dirty, that is, dependents of volatile or changed data, and cells programmatically marked as dirty. If the calculation mode is Automatic Except Tables, this calculates those tables that require updating and also all volatile functions and their dependents.
VBA: Application.Calculate

SHIFT F9

Recalculates the cells marked for calculation in the active worksheet only.
VBA: ActiveSheet.Calculate

CTRL ALT F9

Recalculates all cells in all open workbooks. If the calculation mode is Automatic Except Tables, it forces the tables to be recalculated.
VBA: Application.CalculateFull

CTRL ALT SHIFT F9

Causes Excel to rebuild the dependency tree and the calculation chain for a given workbook and forces a recalculation of all cells that contain formulas.
VBA: Workbooks(reference).ForceFullCalculation (introduced in Excel 2007)

References


Why Can’t Planners Access Essbase

In Hyperion 11.1.2.1, there is a change in how security is deployed. If you are having an issue deploying Planning security with Essbase adhoc access, and the user can’t

  1. Access Essbase Adhoc
  2. Access FR reports using an Essbase connection
  3. Access Essbase directly

you are not alone.This is not classified as a bug, but it sure can cause a lot of frustration. If you have a user that needs access to Essbase directly, the user can’t be associated to ONLY Planning applications. For them to get access to Essbase, even to access the Planning application, they must have security to a native Essbase application (a NON Planning application).

From the Oracle Doc ID 1328741.1

SYMPTOMS

Trying to add the “Essbase” application access type to a Planning user in Shared Services so the user can access native Essbase applications using the Excel Add-in. Shared Services confirms the update when saved but when checking the user again, it only has “Planning” access. This also happens when trying to use the MaxL command to modify the application access type.

CAUSE

Starting in EPM v11.1.2, a user’s type (application access type) cannot be changed by Maxl, the EAS console or manually via Shared services console. The type is automatically assigned based on the roles that the user has.

  • If a user has a role on a Planning application only, then that user is treated as a Planning user.
  • If the user has a role on a Essbase application only, then the user is treated as an Essbase user.
  • If the user has roles on both Planning and Essbase applications the user is treated as a Planning and

Essbase user.

SOLUTION

In order for a Planning user to access native Essbase applications in the Excel Add-in, the user will need to be given access to a native Essbase application. For example, assign the Planning user “Read” access to the Demo application.


What’s New with Smart View

The newest release of Smart View (Release 11.1.2.1.102) includes many helpful, long-awaited features sure to both enhance the end-user experience and increase productivity. Many of the new features are examined below while a complete list and their descriptions can be found here.

Ad Hoc Operations in Multiple Cells

Previous versions of Smart View limited users to cell level ad-hoc operations. For example; say you wanted to ‘Zoom In’ on a member, Smart View limited this action to a single cell (single member). The newest version allows users to select a range of cells before performing an action allowing for quicker answers. Multi-cell actions such as Zoom In, Zoom Out, Keep Only and Remove Only are now permitted.  

Member Information

End users of Smart View often struggled to find additional information pertaining to members of a dimension from which they queried. This problem has been remedied with the new ‘Member Information’ button located in the Essbase ribbon. When focused on a single Essbase member, users can click the Member Information button and be presented with multiple member properties such as:

  • Dimension Name
  • Member Level
  • Member Generation
  • Parent/Child Name
  • Consolidation Operator
  • Alias Tables
  • Alias Names
  • Attributes
  • Formulas
  • Comments
  • User Defined Attributes (UDAs)

Linked Objects

End users with proper access can now add/ access ‘Linked Reporting Objects’ and ‘Linked Partitions’. Having Linked Reporting Object access allows for cells notes, external files and URLs to be linked to Smart View data cells for reference. Access to Linked Partitions enables connection between 2 separate databases. This allows users to navigate database ”A” while connected to database “B”, opening up additional data analysis opportunities.

Displaying Member Names and Aliases

Previous versions of Smart View generated a common complaint centered on the display of member names versus aliases. Essbase and Planning users familiar with the Essbase Add-In were accustomed to displaying both member names and aliases in a retrieve. These users had become frustrated by Smart View’s inability to function similarly. This problem has been fixed with Oracle’s latest release whereas users now have the option to display member names and their aliases, side-by-side, on retrieves.

POV Toggle

The ‘POV Toggle’ button allows end-users the ability to move dimensions from the Smart View POV Toolbar to row one, thus placing all dimensions on the grid. Users familiar with the Essbase Add-In will appreciate this functionality, allowing ‘power users’ quicker retrieve setup times. This can easily be switched back with the click of the POV Toggle button.

Sheet Level Options

Previously, all Smart View specified Options were global in nature. Options found in the ‘Options’ dialog box including ‘Member Options’, ‘Data Options’ and ‘Formatting Options’ are now sheet specific, allowing for multiple sheets to function with their own definitions. This means ‘Sheet 1’ could drill to the bottom level and display only member names while ‘Sheet 2’ could drill to the next level and display the combination of member name and alias. Note that options found in ‘Advanced Options’, ‘Cell Styles’ and ‘Extensions’ remain global in nature.

Butterfly Reporting

One of the commonly used features of Financial Reporting involves the use of ‘Butterfly’ reporting. Butterfly reports display a column of dimensional members between two columns of data.

New Zoom Options

Users now have additional ‘Zoom’ options including:

  • Same Level
  • Sibling Level
  • Same Generation
  • Formulas (retrieve data for all members that are defined by the formula of the selected member)

Submit Data without Refreshing

Gone is the requirement to refresh a grid prior to submitting data while in Free-Form mode.


As noted above, this review includes many, but not all new features released with Smart View 11.1.2.1.102. Please visit Oracle for a complete list and description of each new feature.


What’s New in Hyperion Essbase 11.1.2?

Working with people new to Essbase every three to six months, I am always looking for ways to show users their hierarchies effectively. Many of them don’t have access to Essbase administration services or EPMA.  So, I always fall back to excel as a distribution method, as well as documentation, to show hierarchies.

Expanding hierarchies to all descendants is a great way to show small hierarchies, but, I am always asked to make it a collapsible hierarchy using the Excel grouping feature. The challenge of doing this manually to a hierarchy with thousands of members is that it is extremely time consuming and very error prone.

The following script can be added to any workbook to automate this effort.

Sub CreateOutline()
    Dim cell As Range
    Dim iCount As Integer
    For Each cell In Selection
        'Check the number of spaces in front of the member name 
        'and divide by 5 (one level)
        iCount = (Len(cell.Value) - Len(Trim(cell.Value))) / 5
        'Only execute if the row is indented
        If iCount <> 0 Then cell.EntireRow.OutlineLevel = iCount
    Next cell
    MsgBox "Completed"
End Sub

Setup

First, this sub routine has to be added to a workbook.  Open up the visual basic editor. Right click on the workbook in the project explorer window and add a new module. Paste the code above in the new module.  The editor is in different places in different version.  In Excel 2007 and 2010, the Developer ribbon is not visible by default.  To make it visible, go to the navigator wheel and click Excel Options.  There is a checkbox named Show Developer Ribbon that will make this developer ribbon viewable.

How To Use

First, open the member selection option in the Essbase add-in or smart view and select the parent.  Add all its descendants.  Alternately, change the drill type to all descendants and zoom in on the member of the hierarchy.

Retrieve, or refresh, the data, and make sure the indent is set so the children are indented.  Now, highlight the range of cells that has the hierarchy/dimension that the grouping should be applied. This should include cells in one column of the worksheet.  Open the code editor and place the cursor inside the sub routine you added from above and click the green play triangle in the toolbar to execute the script.  When this is finished, go back to the worksheet with the hierarchy and it will have the hierarchy grouped.

Excel limits the level of groupings to eight. If the hierarchy has more than eight levels, they will be ignored. Now, the hierarchy can be expanded and collapsed for viewing.

Shortcut keys or toolbar buttons can be assigned to execute this function if it is used frequently. If you are interested in doing this, there are a plethora of how-to articles on this topic.  This Google search will get you started if you choose to go down that path.

So, the next time you need to explain a hierarchy in Essbase, or distribute it in a common format, hopefully this script will help.


Empower Users To Improve Calculation Times

As an Essbase user, you have more power to improve performance than you think.  How many times do you lock and send data through Excel, SmartView, or web forms, that include zeros?  How many times do you allocate data to a finite level out of convenience?  Understanding what this does to Essbase is critical to understanding how a user can negatively impact performance without adding any value to the analysis or the results the database produces.

I analyzed a planning database used in one of the largest financial institutions in the world.  Over 60% of the values entered were zero.  Another 20% of the values were less than 1 dollar.  By eliminating the zeros, the total calculation time of the planning application was under 20 minutes.  With the zeros, it was nearly 2 hours.

There are two reasons for this.  First, there is a different between empty and zero.  Empty consumes no space to store whereas a zero consumes the same space as 1 billion.  Think of this as a grocery bag.  If you fill a grocery bag with nothing, it takes up no space.  If you fill it with empty cans (a zero), it consumes the same amount of space as if those cans were full (1 billion).

The example below is very common.  Assume that a forecast needs to be done for the last 3 months of the year.  Frequently, a spreadsheet would hold zeros for the first 9 months.  18 cells have zero and 6 cells have a positive value.  That means that 75% of your data could be eliminated by not loading zeros.

The same load with #Missing is more effective.

I highly recommend reading the article explaining dense and sparse to understand what a block is and what it represents before you continue this article.

There is also another very significant factor in loading zeros.  Loading a zero that creates a block just to hold a value of zero can explode the size of the database, as well as the time it takes to consolidate and execute business rules.  The more blocks that have to be loaded and consolidated, the longer it takes to finish.  If each block was a spreadsheet and you had to do this manually, you would have to open each spreadsheet and enter the number into a calculator to consolidate.  If 75% of the blocks you opened were zero, it wouldn’t change your total, but it would drastically increase the time it takes because you still have to open each spreadsheet.   If an Essbase database has 1,000 blocks, and 75% of them only hold zeros, it will likely take 2 or 3 times longer to calc the zeros because it still has to open the block and add the zero.  Remember, a zero acts no differently than a value of 100.

As an example to the above, the following example would create a block for South and West, inflating the database size.


Users can significantly reduce this unnecessary explosion in size by loading a blank as apposed to a zero.  If zeros are already in the database, leaving the cell blank will NOT overwrite the zeros.  If zeros are loaded inadvertently, a #Missing has to be used to remove them.

For all you users loading data, it can be a hassle removing the zeros.  Being responsible can significantly improve your experience with Essbase.  To make it easier, take a look at the function in the In2Hyperion Excel Ribbon that replaces all zeros with #Missing.