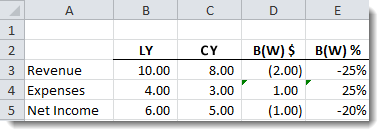
Creating Row and Column Templates

When developing it’s always best to avoid “recreating the wheel” and the same concept applies when building reports in Hyperion Financial Reporting. An important step in the design phase centers on report row and column sets; these are simply the groups of members which display in the rows and columns of each report. Any reports that “share” groups of members, whether in rows or columns, provide an excellent opportunity for creating Hyperion Row and/or Column Templates. These templates can then be referenced in additional reports, resulting in decreased development effort and less maintenance.

Benefits: When needing to create multiple reports which have similar or identical row and column sets, the user can save time by creating one standardized row and column set, saving it as an object in the repository, and reusing it for multiple reports.  The user also has the ability to modify a row/column template at any point and resave it into the repository which automatically updates all grids linked to the template.  
Creating Row & Column Templates
The building of Row and Column templates starts with building the “row set” or “column set” in a report grid. You use the FR Client to build row and column templates just as you would build FR reports. The example below will walk through creating a row template keeping in mind that the same steps will be taken to create a column template.

Step 1: Create a new FR report (using the Account Dimension for rows in my example).

Step 2: Highlight the members that make up the row set.
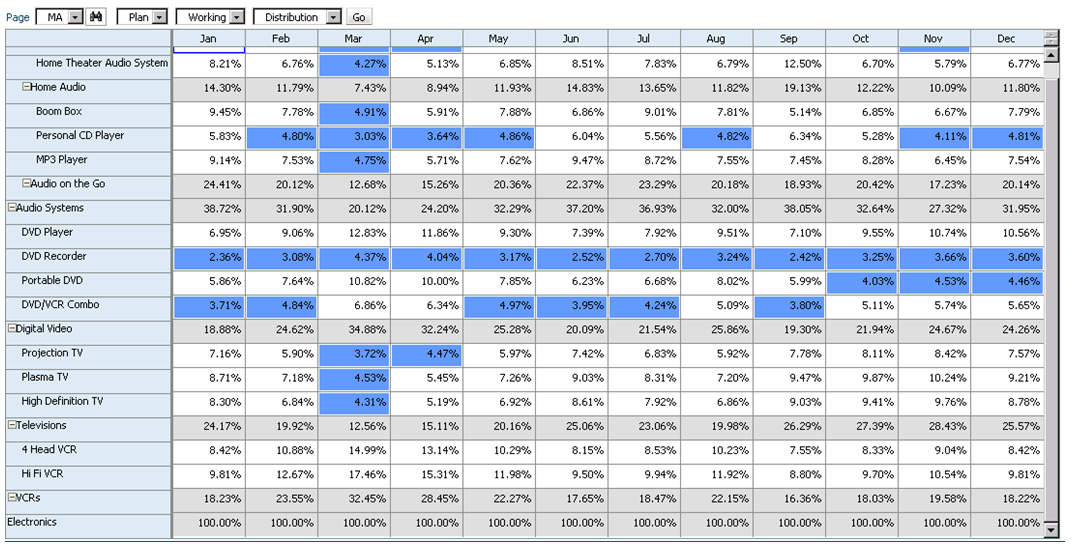
You can select any row (or combination of rows) to create the Row Template. Be sure you highlight the entire row as shown in the image below.

Step 3: Build the Row Template. (Screen shot images below)
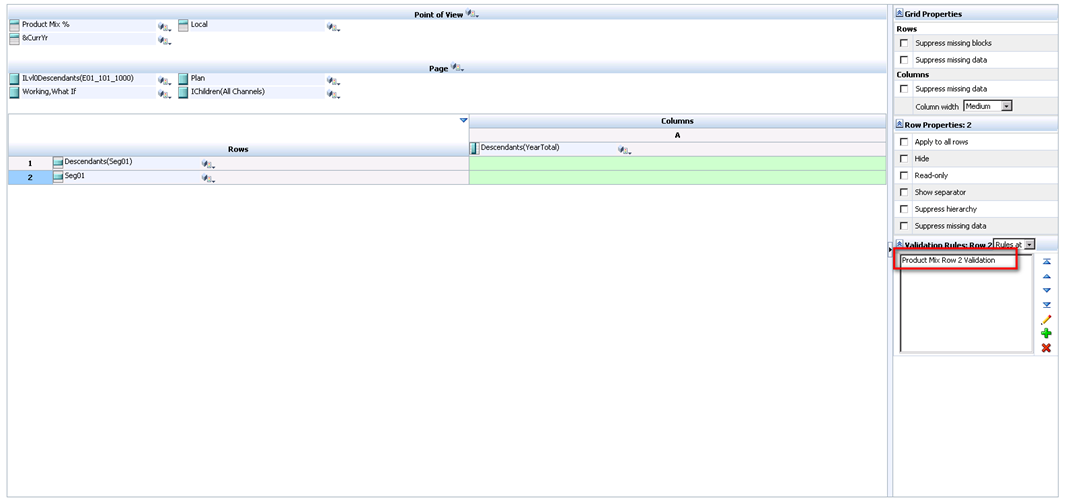
Once you have highlighted the intended set of rows, select “File->Save Object…”. You will notice once you highlight the rows and decide to save an object; the “File Type” will default to “Row and Column Template”.

*Note that you should deselect the option for “Link to Source Object”. When you create the template this option is not necessary. You will select this option later when referencing the object in reports.

You will be asked to make selections for Suppression, Row Height, Column Width and Page Break options.

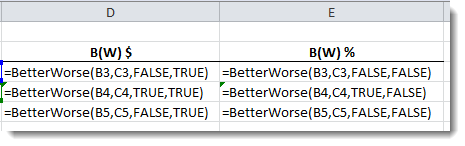
  • Suppression – you can save or inherit any application of suppression (that is, if zero, missing, or error) within the rows and columns selected.
  • Row Height – if you selected a row for your template, you can save or inherit any application of row height, which can be changed manually or numerically from the Row Height text box on the Row Properties property sheet, within the selected rows and columns.
  • Column Width – if you selected a column for your template, you can save or inherit any application of column width, which can be changed manually or numerically from the Column Width text box on the Column Properties property sheet, within the selected rows and columns.
  • Page Breaks – you can save or discard page breaks specified within the rows and columns selected.

Once you have made your selections, click OK. This completes the Row Template build process. Note that you don’t have to save the report which was just created – you can just choose to close it. The Row Template will have saved.

Adding Row & Column Templates to a Report
Once the Row Template has been created it can be referenced in any report – making sure that the Row Dimension(s) are the same as that in the Row Template. The steps below walk through pulling the Row Template into a report. *Note that the report which will contain the linked Row Template can also include additional data, formula, or text rows.

One requirement for adding the Row Template into the report is the addition of at least one data row. This data row can be hidden on your report, but Hyperion FR requires a minimum of one data row in addition to your Row Template.

Step 1: Inserting the Row Template
To add the Row Template, highlight the row below row 1, right-click and select “Insert Row and Column Template”.

Navigate to and select the needed Row Template. Be sure the check box for “Link to Source Object” is selected. Click “Insert”.

Notice that the Row Template has been added (identified by the yellow cells). You will need to save this report. When the report is run you will now see all rows from the Row Template linked to the report.

Modifying the Row & Column Template
In order to modify an existing Row Template you must open a report which references the Row Template. Note that you cannot open the actual Row & Column Template; it will result in an error message.

Step 1: Open a Report that references the Row Template

Step 2: Unlink the Source Object
To unlink the source object you must first highlight the Row Template rows on the report. You will be prompted to verify that you want to “Unlink the Object”… select “Yes.”

Step 3: Modify the Report
Make any necessary Row modifications such as adding Accounts or changing formatting.

Step 4: Re-Save the Object
Follow steps 2 and 3 from the “Creating Row & Column Templates” section above making sure to resave the template.  You will be prompted to verify if you want to “Overwrite the existing file”…select “Yes”. Once the modifications are finished and the Row Template is re-saved, any reports referencing that Row Template will automatically update.


How To Maximize Excel by Using Custom Function

Whether you play a technical role or are a financial analyst, Excel is likely a major asset in your toolbox. Whether it is the SUM function, the VLOOKUP function, or one of the many others, we have all used Excel functions for a plethora of reasons. 

There is a lot of potential hidden in Excel that you may not be aware of.  Excel offers the ability to create your own user defined functions, and it’s not hard to create them.  With a little ingenuity and strategic thinking, custom Excel functions can be a huge asset.  

Below are two examples.  Neither is difficult, but they will provide you with a taste of what you can do with custom functions.  The first example calculates a better/worse value based on three inputs (prior period, current period, and expense vs. revenue).  The second concatenates columns together with a user specified delimiter and the option to use quotes around the values.

Background on Custom Functions

Custom functions are Visual Basic for Applications (VBA) code snippets that are stored in modules in a workbook.  This is the same place macros are stored, so it may be familiar.  To open the VBA window, use ALT F11.  Once the window opens, right-click the workbook you want to add the function to in the VBAProject window and select Insert->Module.  A new window will open named Module1.  Custom functions have to be in a module to be accessed in a workbook.

Each function has a function name, input arguments that pass data to the function, and return a value.

A very simple example shows these pieces.  “Test” is the function name.  “Input” is one argument passed to the function.  The function returns a numeric value, which is the input value multiplied by ten.

Function Test(input as double) as Double
    Test=input * 10
End Function 

To use this function, return to your worksheet and enter “=Test(5)” in a cell.  This function can also be found in the Insert Function option by selecting User Defined in the Select A Category dropdown box.  The input parameter doesn’t have to be a value.  A cell reference can be used, just like any other Excel function.  The result should return 50.

Example:  Better(Worse) Calculation

For you finance folks, you will almost always have a better/worse calculation in a spreadsheet that compares two periods.  For revenue, the current period is subtracted from the prior period.  For expense, it is the inverse. 

To accomplish this, we will have a function with 4 parameters. 

  1. Prior Period
  2. Current Period
  3. Whether the numbers being evaluated should be calculated as an expense or revenue
  4. Whether the result returned is in the form of a dollar value or percentage change
Function BetterWorse(Prior_Period As Double, Current_Period As Double, Expense As Boolean, Return_Dollar As Boolean) As Double
    If Expense = True Then 'Calculate as an expense
        If Return_Dollar = True Then 'Return a dollar value
            BetterWorse = Prior_Period - Current_Period
        Else 'Return a percentage
            BetterWorse = (Prior_Period - Current_Period) / Prior_Period
      End If
    Else 'Calculate as a revenue
        If Return_Dollar = True Then 'Return a percentage
            BetterWorse = Current_Period - Prior_Period
        Else 'Return a percentage
            BetterWorse = (Current_Period - Prior_Period) / Current_Period
      End If
    End If
End Function

Below is an example of this function being used.  The result of the custom function resides in column D and E.  Revenue is lower in the current year, resulting in a negative variance.  Expenses are also lower, but result in a positive variance.

The formulas that exist in columns D and E are as follows.

Example:  Concatenation

The need to create a delimited file from Excel is very common.  The problem with doing this is that the entire worksheet is extracted.  If the worksheet had data in rows or columns that are now blank, Excel still exports those blank cells.  One way to overcome this is to create a function that concatenates a range into one cell.  Then, the concatenated values can be copied and pasted to a text file.  Many times this is very handy.  This can obviously be done with a cell formula, but gets time consuming to create when many cells are required.  It is further complicated when quotes around the fields are necessary. 

Function ConcatForExport(InRange As Range, Delimiter As String, UseQuotes As Boolean) As String
    Dim TheCount As Integer
    TheCount = 0
    For Each cell In InRange
        If TheCount = 0 Then
           If UseQuotes = True Then
              strString = Chr(34) & cell.Value & Chr(34)
           Else
              strString = cell.Value
           End If
        Else
           If UseQuotes = True Then
               strString = strString & Delimiter & Chr(34) & cell.Value & Chr(34)
           Else
               strString = strString & Delimiter & cell.Value
           End If
        End If
        TheCount = TheCount 1
    Next cell
    ConcatForExport = strString
End Function

To expand on the variance example above, an additional column has been added to show the use of this function.  Each row passes different parameters.  Columns B through E are concatenated together into one cell.  The delimiter is altered in row 5, and no quotes are around the value in row 4.

The corresponding formulas are below.


There are a wealth of opportunities that open up using custom functions.  Adding functionality and automating tasks like the examples above are just the start of what can be done. 


KScope12 is coming to San Antonio!

I attended many Hyperion Solutions conferences back in the day.  I really enjoyed the experience, but after the first couple of years, I didn’t feel like I was getting my money’s worth.  I started to wonder if I knew all there was to know about Essbase, as every presentation I attended seemed very basic.  Was I that good?  Did the benefit of attending these conferences shift from knowledge gain to networking? I decided to stop attending. 

Last year, Jake Turrell invited me to become be part of the Kscope12 Hyperion Planning track selection committee.  Being away from the conference scene for so long, I jumped at the chance to find out how presentations were selected.  I thought it would be a great opportunity to be part of a team that was trying to make the conference content better.  I was extremely impressed with the topics, but was still hesitant on how valuable attending the conference would be for me, outside of networking.

Two words express what I experienced in San Antonio.

HUMBLING and EXCITED

I was never involved in the abstract selection process for the Hyperion Solutions conference, so I’m unable to compare the marketing behind the process of collecting and selecting abstracts, but I can say with conviction that every presentation I attended far exceeded my expectations.

This year, I was asked to take on the role of committee chair for the Planning track.  My goals were simple – to set measureable and meaningful evaluation standards that a democratic group of experts could use to make the best decisions on the presentations for Kscope13 and continue its presentation excellence.

To provide you a little background, presentations were ranked and selected according to the content, regardless of presenter’s industry exposure.  Once the presentation was paired to the presenter, we verified that

  1. No presenter dominated a track
  2. No consulting company dominated a track
  3. The consulting/customer ratio was reasonable
  4. A presentation that was known to be presented at a national or regional conference was excluded, unless there was an overwhelming reason for it to be presented again
  5. Presenters’ abilities were verified by interviews, or feedback by an industry contact that knew the presenter

There was great dialogue among the selection committee to select the abstracts that showed the most promise. Once the abstracts were ranked, a discussion surrounded each one on its merits and possibilities.  This discussion included the presenters’ backgrounds, the content and whether it was presented before.  The selection committee members were not immune to this degree of scrutiny either, as some of my own (the almighty track chairperson) topics were disregarded!

The bottom line is that the committee made every effort to showcase the best of the best, regardless of the presenter’s historical credentials and industry panache.

After the smoke cleared, the selected presentations were tweaked so no presenter or organization dominated the track. The presenters that were not known by a committee member were called and interviewed to ensure the most potential for a great presentation.

If you want to further your knowledge, improve your productivity, network with some of the best minds in our industry, and further your career, join us in New Orleans.  We think the result will be a conference well worth your time and investment.

You are sure to enjoy the experience.


Data Validation Rules in Planning 11.1.2.x

Goodbye to the days of JavaScript in order to enforce data input policies and rules to Planning web forms.  With Planning version 11.1.2 and newer, Oracle has introduced a powerful set of tools for data validation within the Planning Data Form Designer itself.  Let’s walk through a scenario of how this works.

Say that we have a product mix form that will be used to input percentages as drivers for a revenue allocation.  Here’s what the form looks like:

We should expect that the sum of these percentages to be 100% at the “Electronics” parent member.  If this is not the case, the revenue allocation will incorrectly allocate data across products.  So how do we enforce this rule?  Simple… let’s take a look at the data form design.

As a row definition we’ve included two member selections; 1) Descendants(Seg01) or Descendants(Electronics) and 2) Seg01 or Electronics.  We are going to add a validation rule to row 2 of the data form.  To do this, highlight row 2 and click the sign to add a new validation rule.  Notice that in the validation rules section, it now says ‘Validation Rules: Row 2’.

The Data Validation Rule Builder will then be launched. Let’s fill in the rule.  We should ensure the Location is set to ‘Row 2’.  We’ve filled in a name and quick description, then ensured that the ‘Enable validation rule’ check box is checked.

For the rule we’ve defined some simple if logic:

IF [Current Cell Value] != [Value = 1] THEN [Process Cell] ;

To define what occurs if this condition is met we choose the ‘Process Cell’ action defined by the small gear with a letter A next to it.  Here we will highlight the cell red and notify the user with a validation message.

We click through to save the Process Cell definition and the Validation Rule itself and should now see the rule in the data form definition.

So let’s take a look at how the end user will interact with this form.  Percentages are entered by product for each month.  Upon save, notice that all months for Electronics that equal 100% appear normal.  December only sums to 90% and is highlighted in red as we specified in the data validation rule.  We cannot limit the user’s ability to save the form until the cell equals 100%; we can only notify them of the issue, and explain the cause and potential resolutions.

Of course, this is a simple example of what can be done using Planning’s Data Validation Rules.  The possibilities are endless.  Oracle has more scenario walkthroughs in the Planning Administrator’s Guide.  View them here: http://download.oracle.com/docs/cd/E17236_01/epm.1112/hp_admin/ch08.html


Optimizing Your Data Load Improves More Than You Think

The format of the data that is loaded to Essbase is often an after-thought.  But, should it be?  When requesting the data file from a source system, it is more important than you may think to have it sorted to mirror your outline.

Assume an outline has the following dimensions.

  • Period [DENSE]
  • Account [DENSE]
  • Region [SPARSE]
  • Category [SPARSE]
  • Product [SPARSE]
  • Organization [SPARSE]

The most efficient way to receive a data file would be to have it sorted by Organization, Product, Category, Region, and then Account.  Data files load faster when the columns that hold the sparse members are sorted in reverse order of the sparse dimensions that exist in the outline.

The reason the data loads faster is because it opens a block of data only one time.  If the data was sorted by the dense members first, then every block would have to be opened multiple times.  If the same sparse member combinations have 3,000 dense members with data, the block would be opened up to 3,000 times.

There are some more important benefits of doing this, however.  When the block is opened multiple times, the database becomes far more fragmented than it needs to be.   Fragmentation causes calculations to be slower and retrieving data can also be impacted, which can lead to frustrated customers.

By not sorting the data when loaded, every time a data load occurs, any performance issues that may exist are exacerbated.  So, anytime possible, sort the data load files by the last sparse dimension in the outline, the second to last sparse dimension in the outline, and so on.  You may be presently surprised at the benefits.